
99,000+
low and moderate-income families housed
$550 million+
in affordable housing subsidies awarded
$11 Billion+
in private financing leveraged
The housing crisis is a mathematical reality, but it is solved through human collaboration and uncompromising financial structuring.
What We Do
Four pathways to a home in New York City.
Since 1983, we've worked with families, developers and the City to create and preserve affordable housing across all five boroughs.
- For homebuyers
Pathways to Homeownership
We help first-time homebuyers navigate the path to homeownership with confidence and clarity. Through education, counseling, and access to financial resources, we guide you from preparation to closing. - For owners & agencies
Pathways to Asset Management
Converting distressed properties into stable, performing assets through partnerships with public agencies, lenders, and community partners. - For developers
Pathways to Housing Development
We help developers navigate the complexities of affordable housing development. Through sponsorship, financing, compliance, and asset management, we ensure projects are built to succeed. - For communities
Pathways to Housing Access
We help ensure affordable housing remains accessible, fair, and sustainable for the communities it serves. From outreach and lease-up to eligibility verification and monitoring, we ensure regulatory integrity and performance to support long-term housing stability at every stage.
Accelerating Housing Production to Meet Unprecedented Demand
With the City's rental vacancy rate at a historic low of 1.4%, new construction and preservation of existing affordable stock must scale simultaneously. Our pipeline reflects this dual mandate.
Total Units Financed
307,416
Across 8,983 buildings, FY2014 to FY2025
Historical Housing Production
Units financed per fiscal year (Rental vs. Homeownership)
Source: NYC HPD Housing New York Units by Building, FY2014-FY2025
| Year | Rental Units | Homeownership Units | Total |
|---|---|---|---|
| FY14 | 16,976 | 2,653 | 19,629 |
| FY15 | 19,622 | 1,533 | 21,155 |
| FY16 | 19,908 | 2,436 | 22,344 |
| FY17 | 18,819 | 5,964 | 24,783 |
| FY18 | 24,375 | 10,267 | 34,642 |
| FY19 | 22,376 | 2,980 | 25,356 |
| FY20 | 11,840 | 18,125 | 29,965 |
| FY21 | 17,486 | 9,742 | 27,228 |
| FY22 | 15,173 | 709 | 15,882 |
| FY23 | 27,757 | 960 | 28,717 |
| FY24 | 25,729 | 2,251 | 27,980 |
| FY25 | 26,985 | 2,750 | 29,735 |
Units by Borough
Total units financed across all five boroughs
Source: NYC HPD Housing New York Units by Building, FY2014-FY2025
| Borough | Total Units |
|---|---|
| Bronx | 101,188 |
| Brooklyn | 86,885 |
| Manhattan | 71,559 |
| Queens | 41,611 |
| Staten Is. | 6,173 |
Affordability Breakdown
Units by Area Median Income (AMI) level
Source: NYC HPD Housing New York Units by Building, FY2014-FY2025
| Income Level | AMI Range | Units |
|---|---|---|
| Extremely Low | 0-30% AMI | 55,680 |
| Very Low | 31-50% AMI | 83,558 |
| Low Income | 51-80% AMI | 105,521 |
| Moderate | 81-120% AMI | 19,036 |
| Middle | 121-165% AMI | 42,293 |
Inside the Policies Holding NYC Housing Back
Jamie Smarr joins The Broker Brunch to discuss why NYC isn’t building enough housing and what public-private partnerships can do about it.
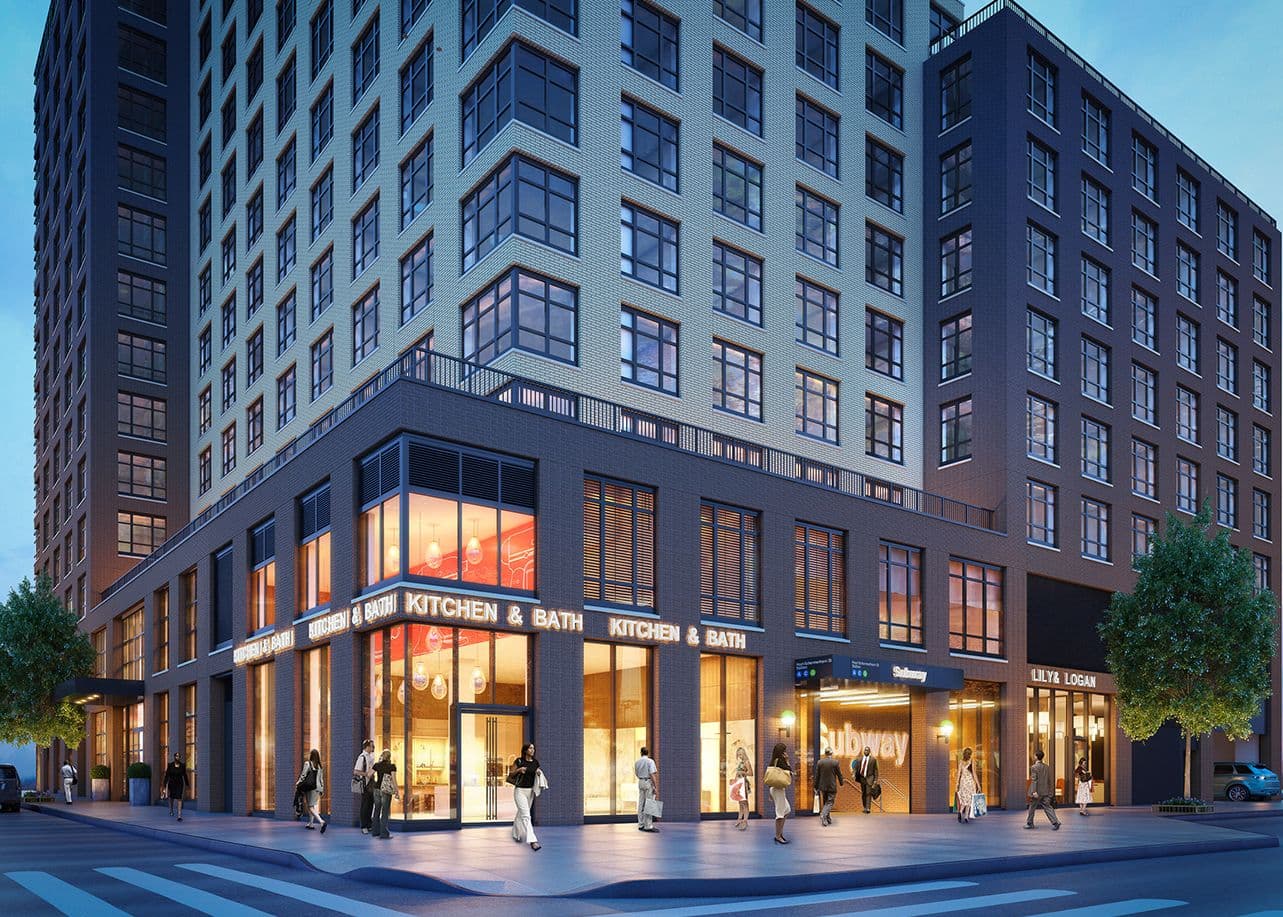
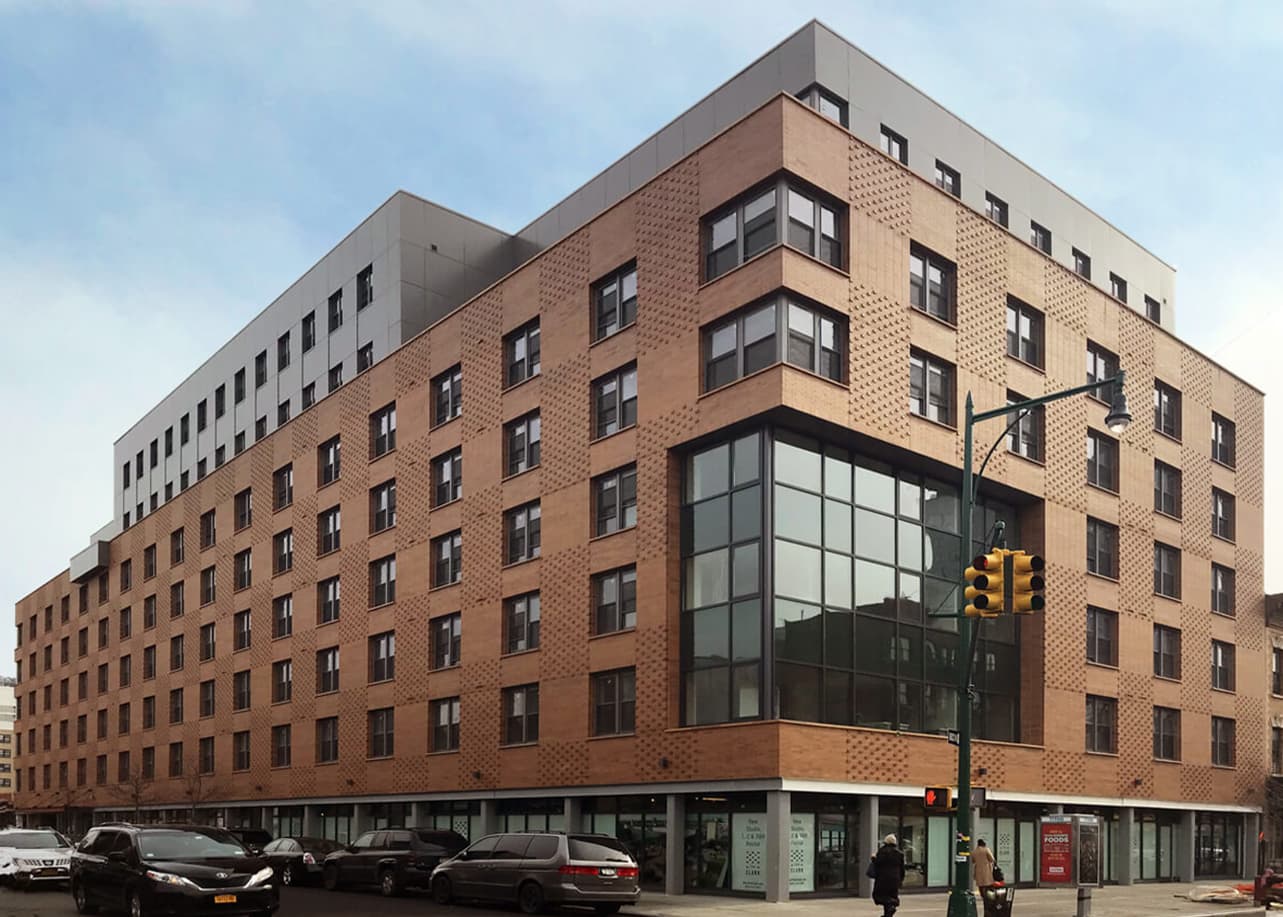
Projects We've Supported
We've been an essential partner in helping create single-family, multi-family, condominium and cooperative affordable homes and apartments for over four decades.


